Today we're releasing email API benchmarks, a real-time dashboard of email provider performance to help you compare SendGrid, Resend, Postmark, and more.
The dashboard is powered by the billions of API requests Knock sends to downstream providers every year. We've aggregated this data to highlight important metrics (like response time and error rate) to help you compare email providers based on their real-world performance data.
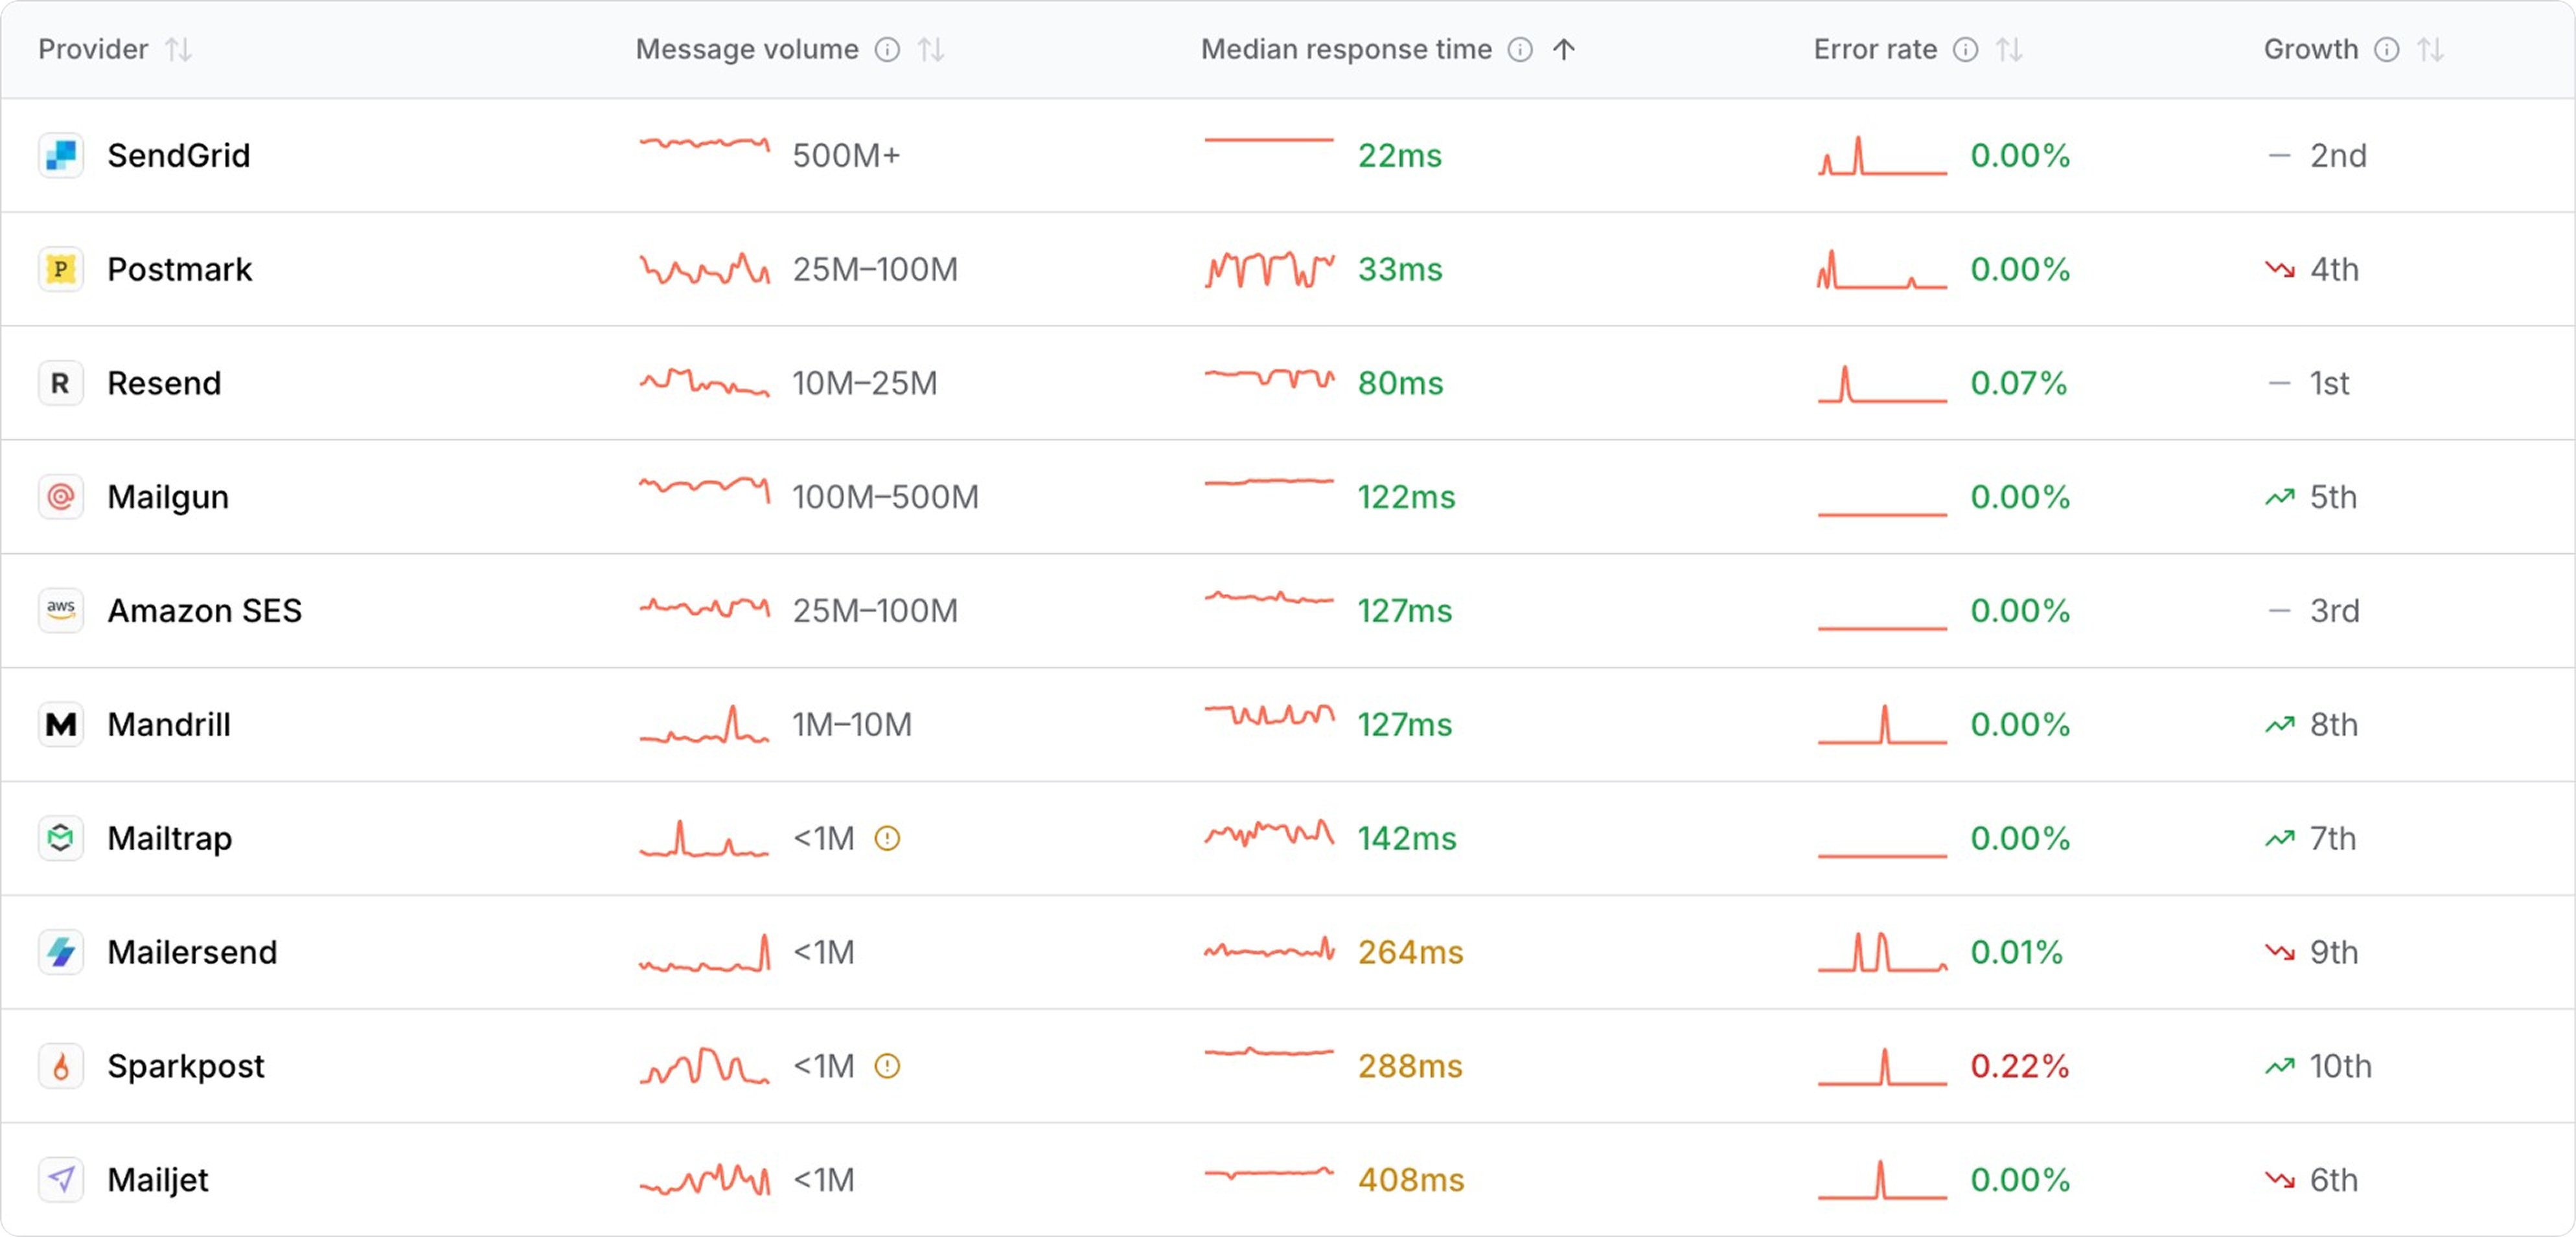
The email API benchmark leaderboard, ranked by median response time
Why we built this
Our customers often ask us which email provider is the best, and every developer we talk to struggles with the same question. The existing resources are mostly vibes — "Best of" articles, anonymous Reddit threads, or LLM recommendations trained on that same content. Objective performance data is always missing.
We believe evaluating a vendor should look the same as profiling a production system: data collected at scale, aggregated over time, under real-world conditions. That's what this dashboard provides.
What's in the dashboard
The dashboard includes data for 10 email providers over a trailing 90-day window, with volume bands that indicate our confidence in each provider's metrics. Here's what we measure.
Response time
We measure response time as the time it takes to receive a 200 from a provider, computed across multiple percentiles (p50, p90, p95, and p99) using exact quantile calculations in ClickHouse. This includes HTTP connection pooling, latency, service time, and any automatic retries, making it a useful indicator of system resilience for time-sensitive use cases like one-time passwords and fraud alerts.
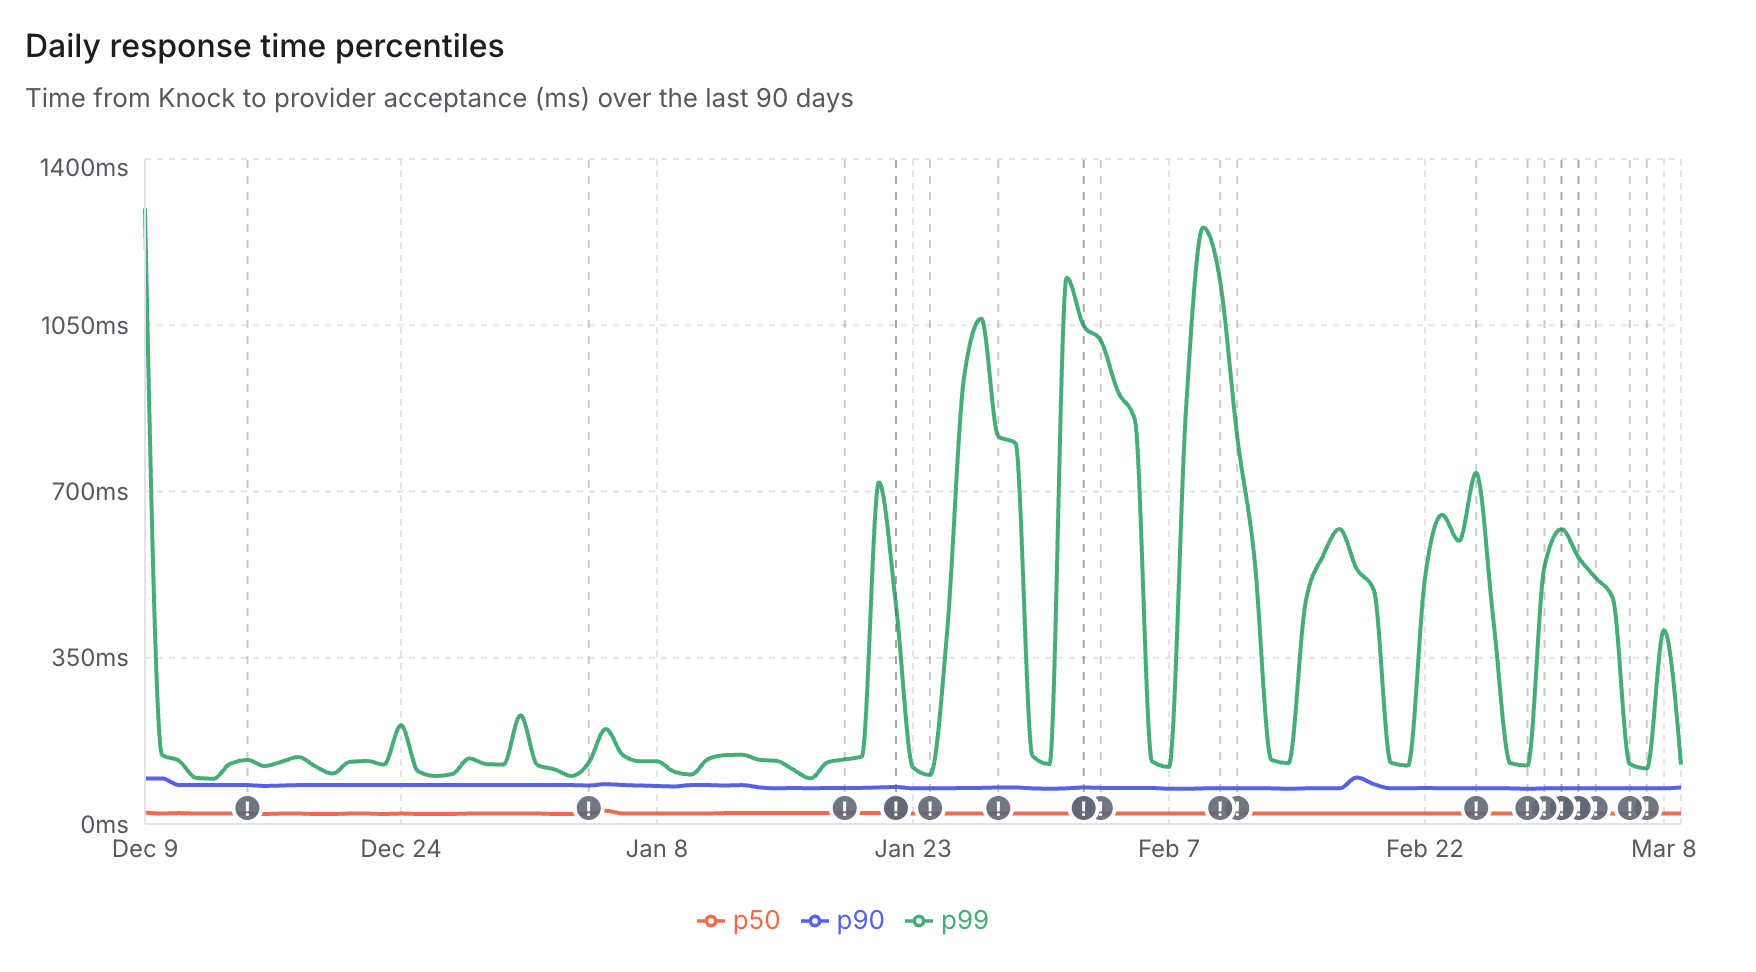
SendGrid response time across p50, p90, and p99 percentiles over the last 90 days
Error rate
Error rate tracks the ratio of 5XX responses to total requests for each provider over the period. Knock's retry logic treats most 5XX codes as retriable, so a single request can produce multiple error entries if the full backoff sequence runs.
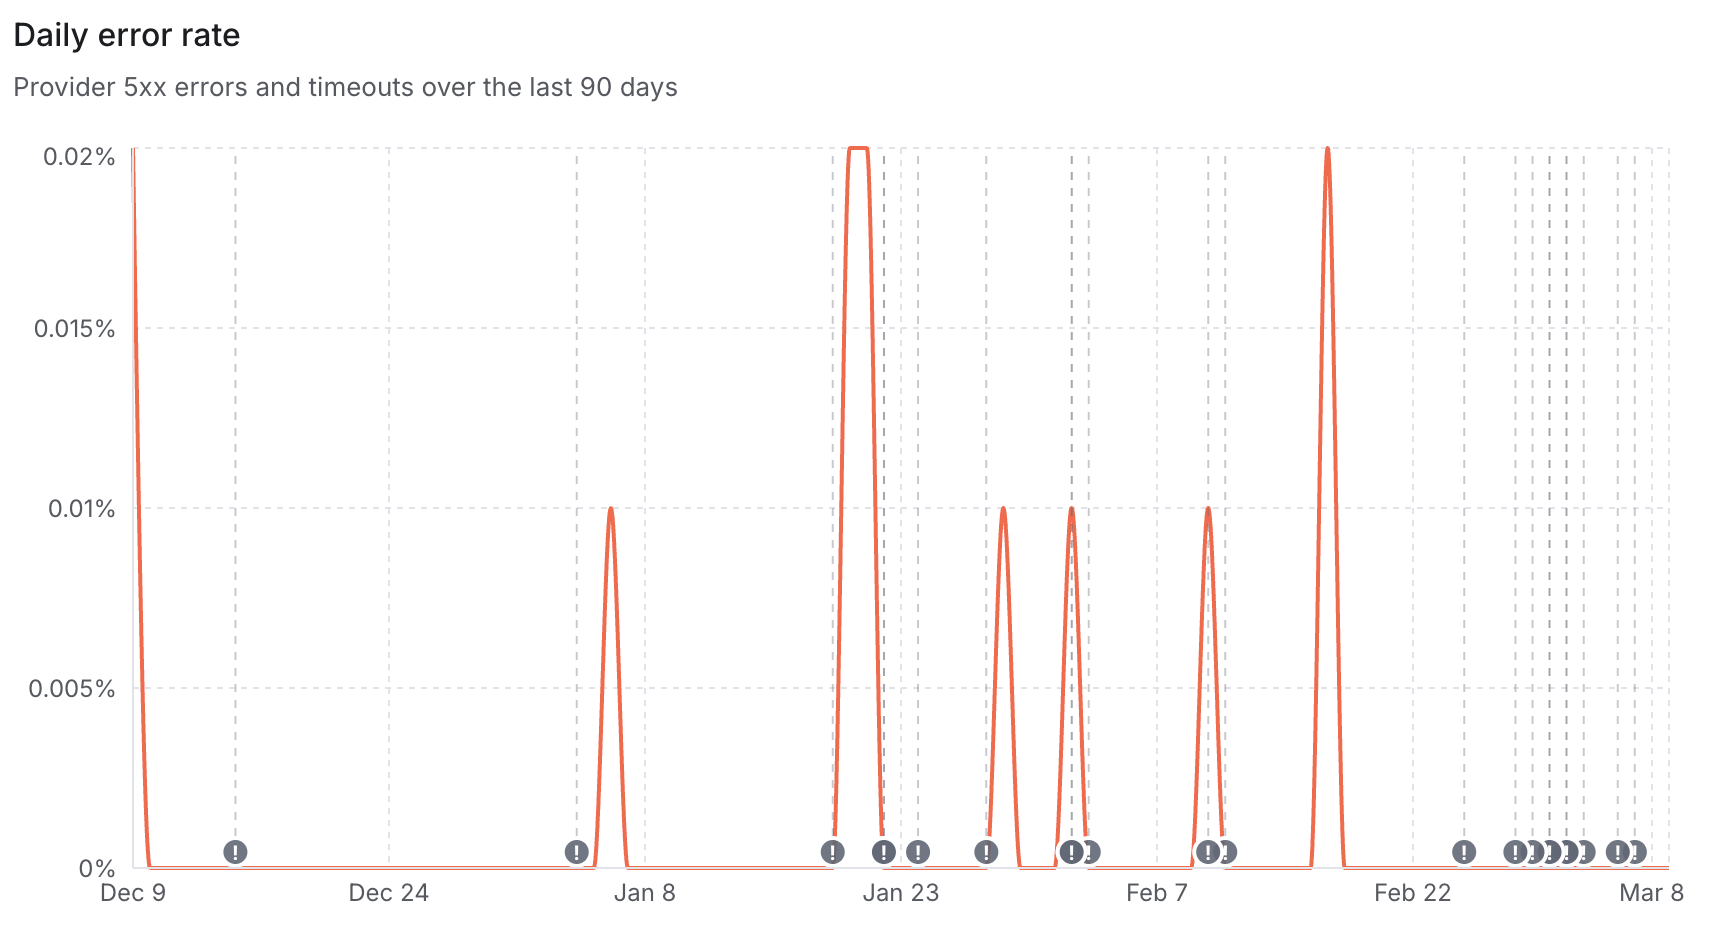
Daily 5xx error rate and timeouts over the last 90 days
Channel growth
We rank providers from one to ten based on new channel connections created during the period, then compare the first and second halves of the window to detect directional trends. This gives you a sense of which providers are gaining or losing adoption on the Knock platform.
Public incidents and status page updates
On each provider detail page, we integrate with the provider's public status page via RSS or API and overlay reported incidents on the performance data we collect. Our view is that observed degradation should correspond with a status page entry, and the degree of correlation between measured performance and public incidents is a useful signal for how a provider handles incident management.
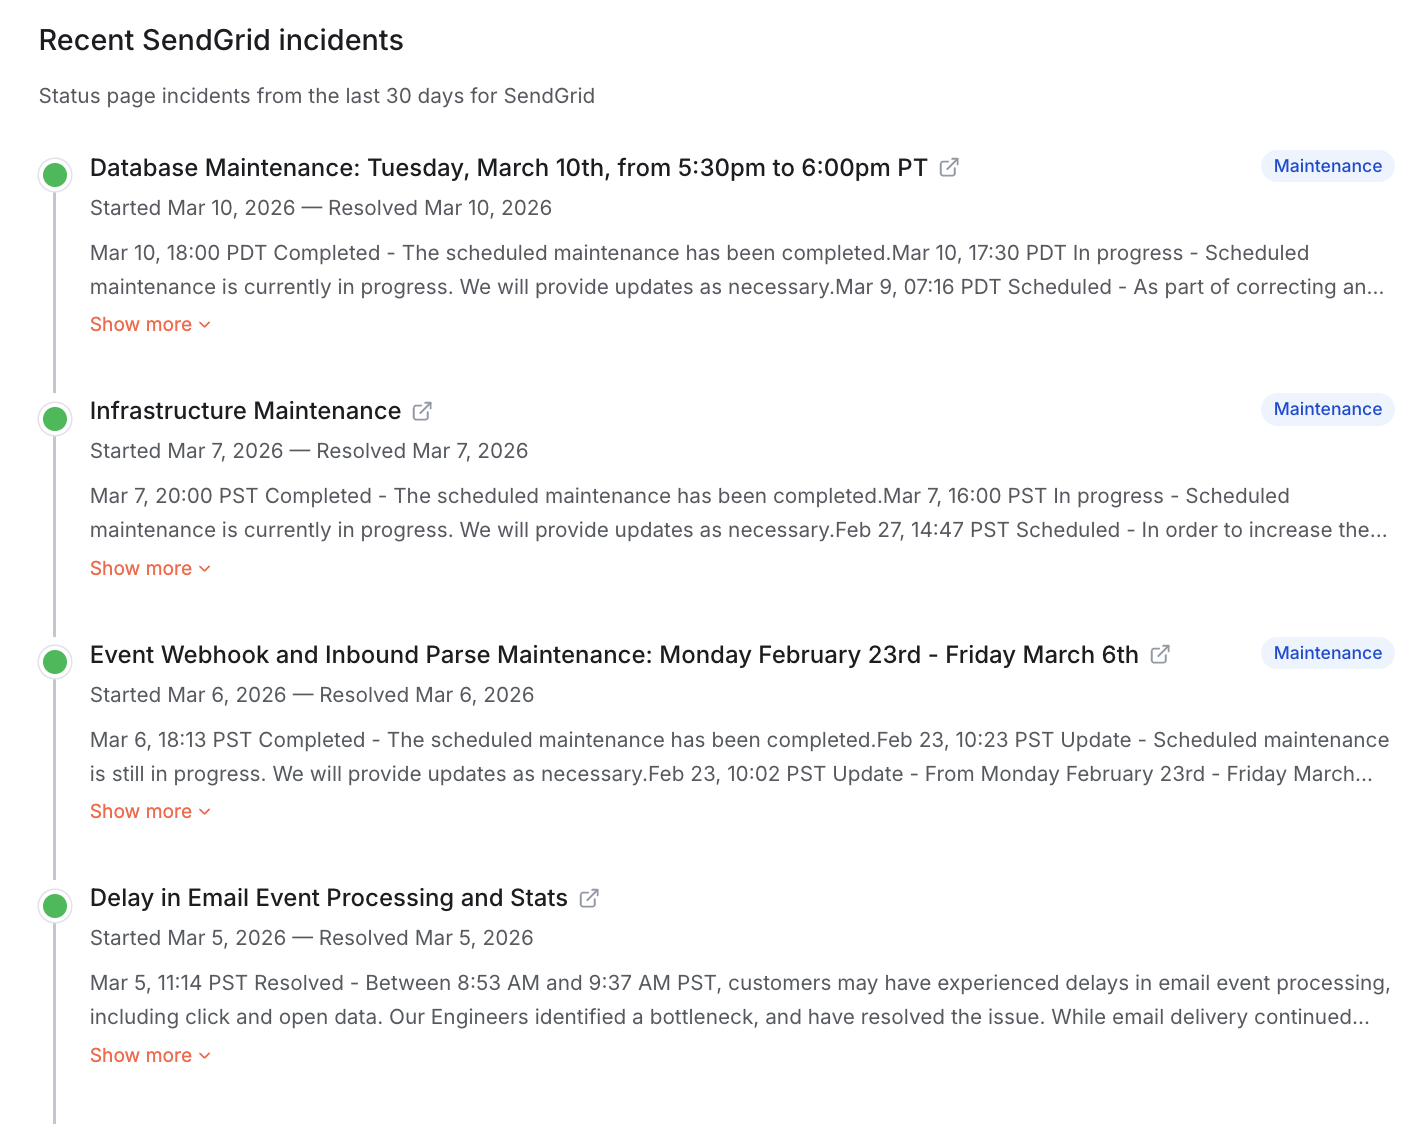
Recent SendGrid status page incidents overlaid on the provider detail page
Pricing comparisons
We've modeled each provider's price curve so you can see how costs scale with volume. The comparison view puts two providers side by side, making it straightforward to weigh pricing alongside performance when evaluating a switch or new integration.
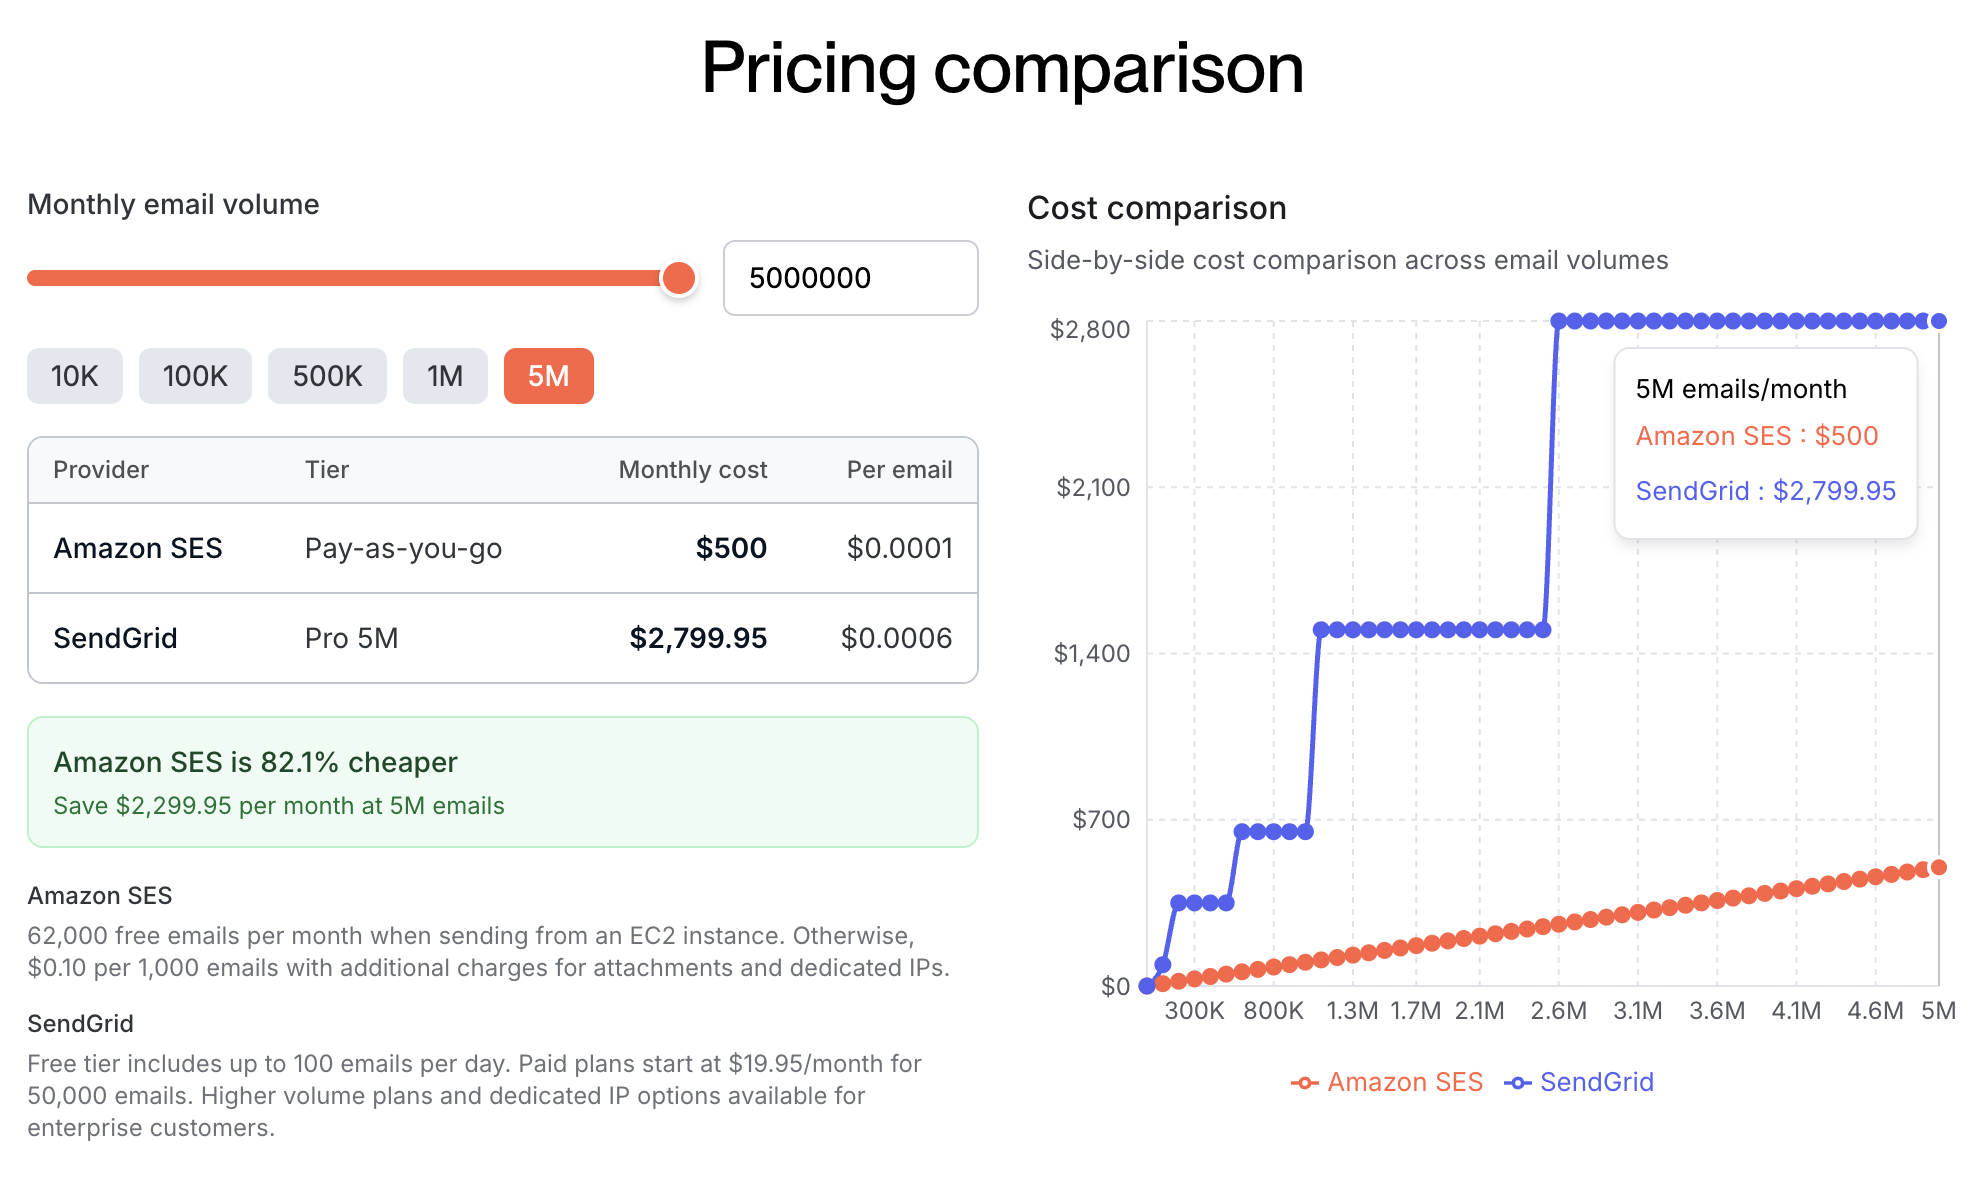
Side-by-side pricing comparison between Amazon SES and SendGrid at 5M emails per month
What's next
We launched with this subset of metrics because they were the most useful and the easiest for us to obtain. We're already exploring the best way to include deliverability and time-to-inbox metrics, and Knock collects a wide variety of downstream message events, like opens, reads, and link clicks. We'd love to hear from the community about what would be valuable to see in a resource like this.
If you're evaluating email providers today, explore the benchmarks and see how your current provider stacks up. And if you're looking for a notification platform that gives you the flexibility to use any email provider — or switch between them without changing your code — sign up for Knock for free.