👋 We’re Knock. We provide a set of simple APIs developers use to introduce notifications into their products, without needing to build and maintain a notification system in-house.
We've recently been working to improve pressure from expensive transactions on one of our Amazon Aurora PostgreSQL databases.
We hoped to leverage Amazon RDS Performance Insights to identify our worst performing transactions, but the metrics from AWS would lump all transaction performance under a single
COMMITstatement.By hacking our Elixir PostgreSQL driver Postgrex, we were able to prepend all transaction
COMMITstatements with SQL comments, forcing performance insights to enumerate our most expensive transactions.
As discussed previously, here at Knock we use Amazon Aurora PostgreSQL instances for all our runtime relational datastores. We're currently addressing some performance bottlenecks in the database that backs the Knock notification engine. In the process of this work we found ourselves in the weeds hacking our Postgres driver, and we wanted to share some fun learnings we've gathered so far.
Aurora performance insights
Amazon provides RDS databases with an optional performance insights dashboard, which when enabled presents a visualization of your database load. Among other capabilities, this dashboard will highlight the most expensive queries in your system by "active session", and further enumerate the types of work each session is doing. In Aurora, an active session is "a connection that has submitted work to the DB engine and is waiting for a response"—in other words, a query using DB resources while executing.
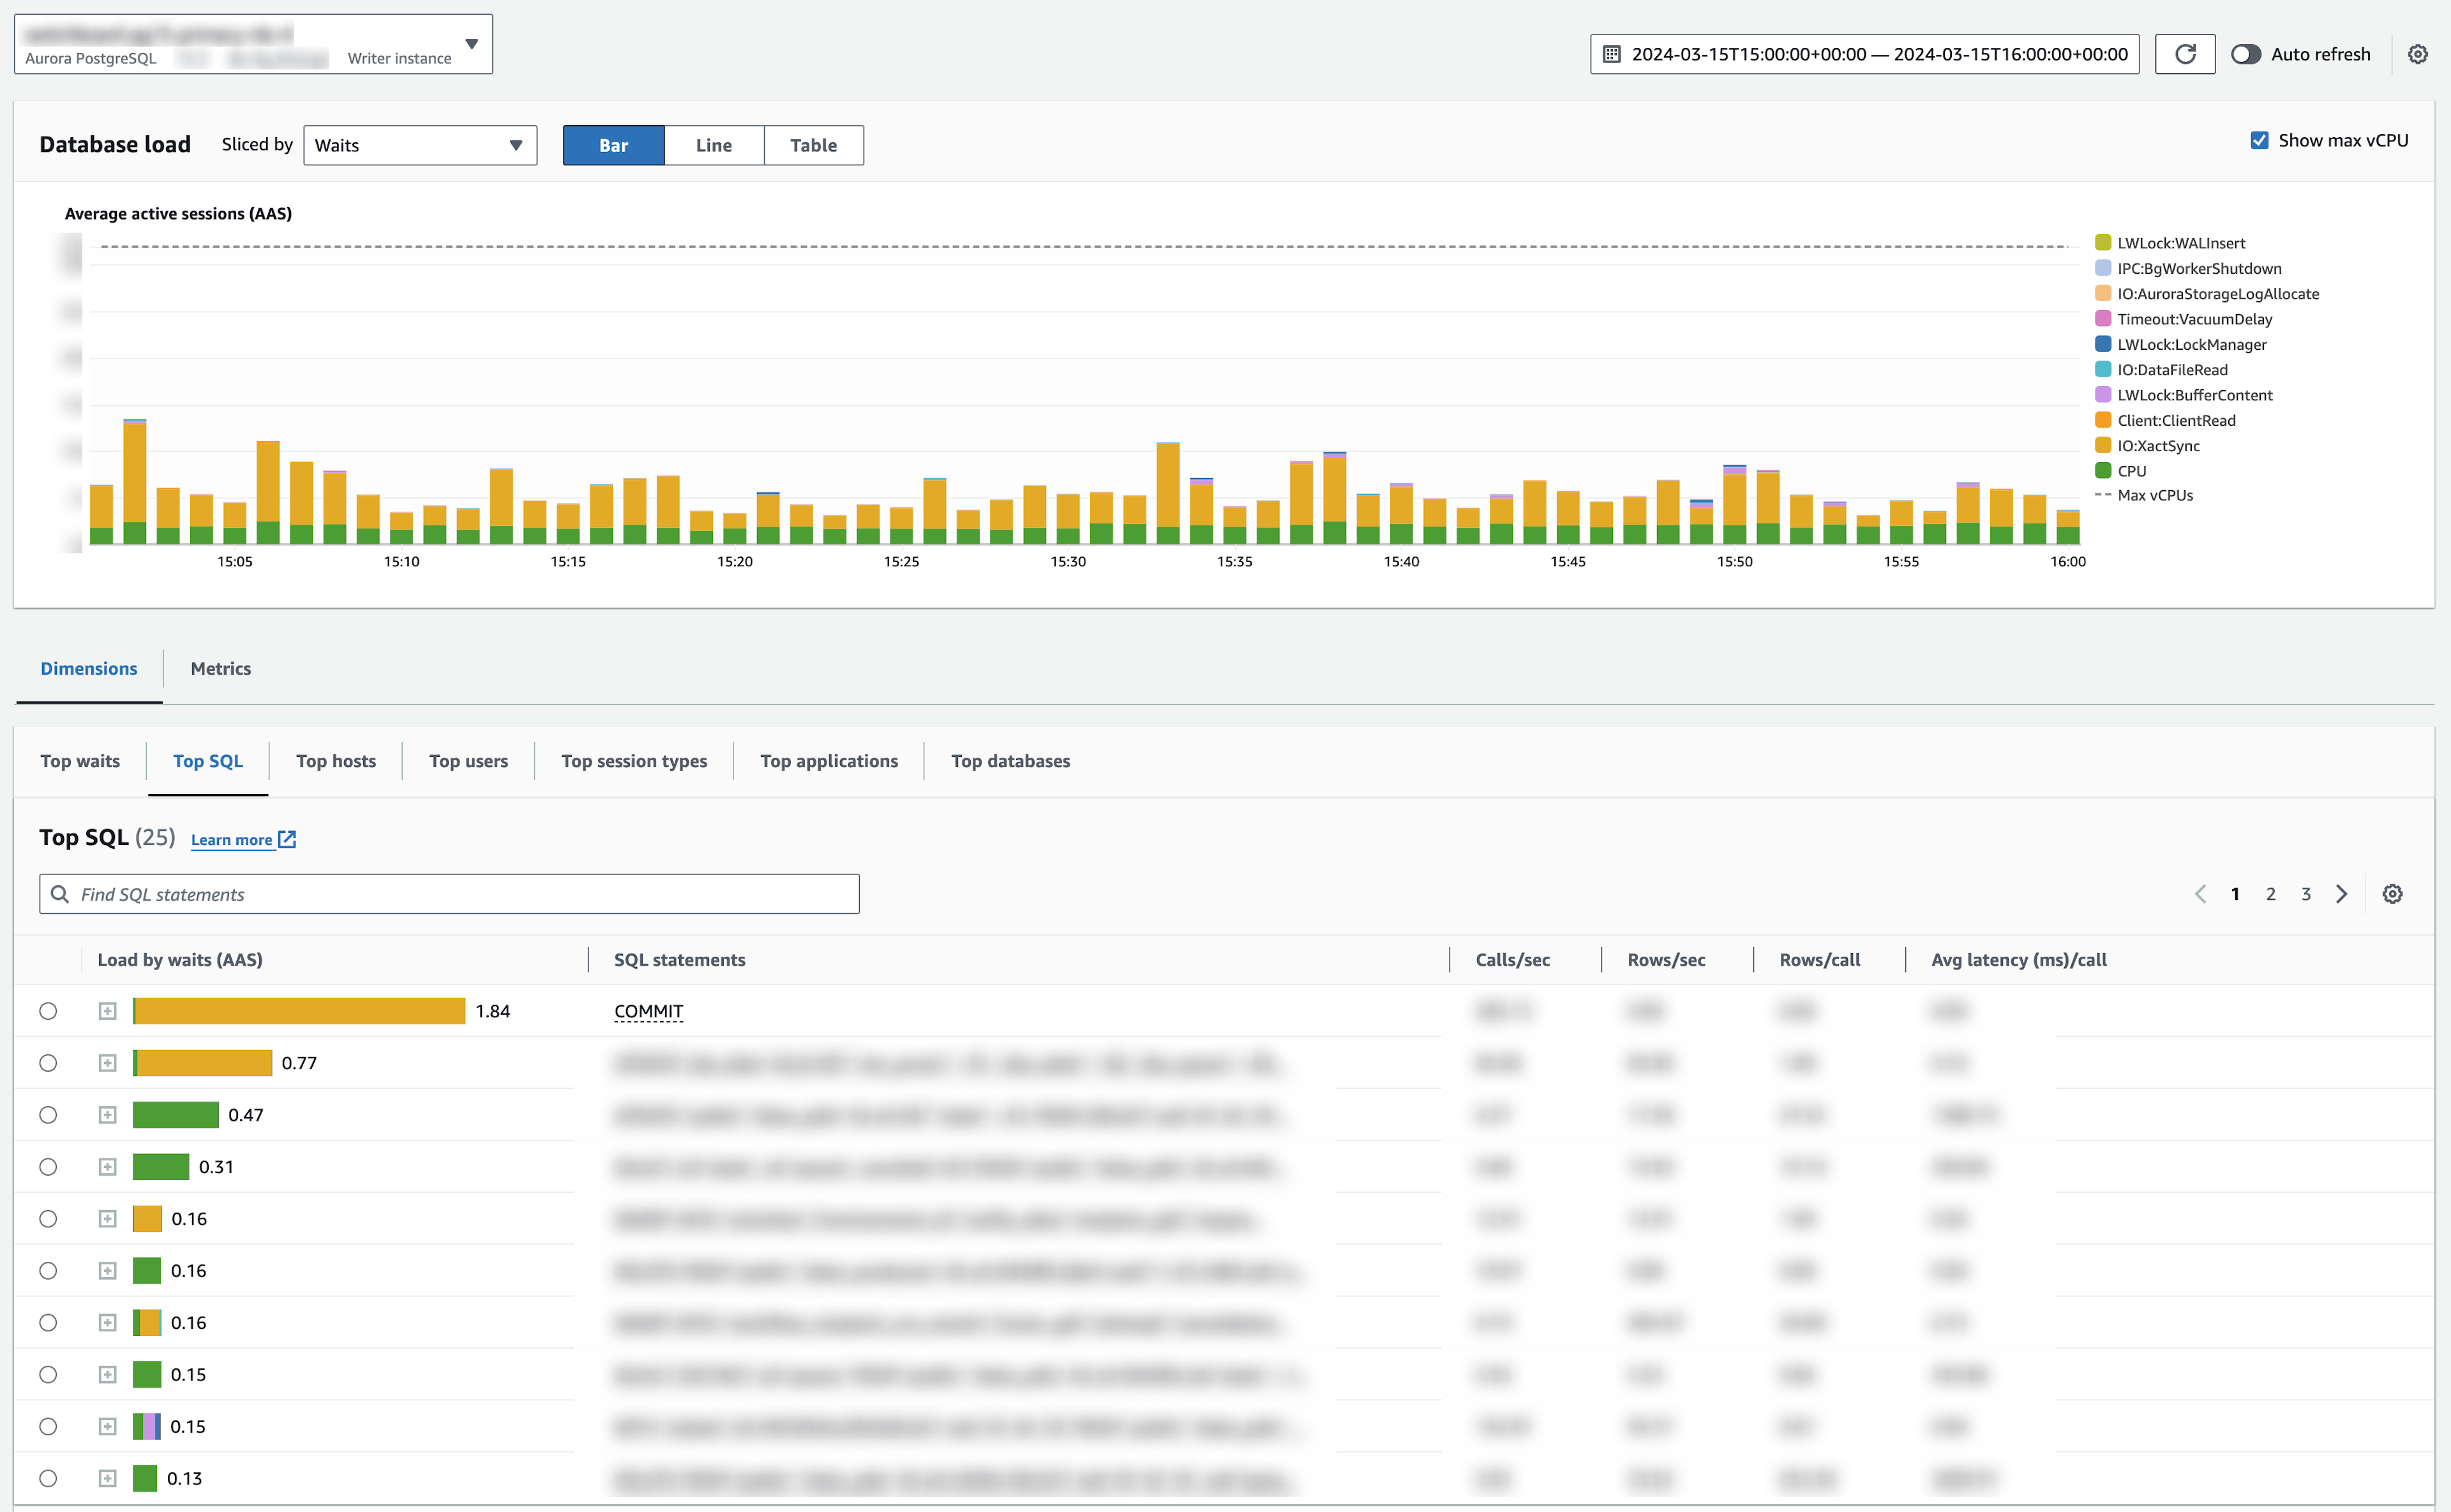
Since the beginning of Knock, we've noticed a few constants in our performance insights dashboard. First, RDS has attributed the majority of our active sessions to IO:XactSync events. This is expected. IO:XactSync events are a type of wait event specific to Aurora, indicating that the database session is awaiting Aurora's distributed block storage model to acknowledge a write. Second, the top query by active sessions has always been, simply, COMMIT, with the vast majority of its session activity dedicated to IO:XactSync writes.
At a high level, this tells us that a majority of our DB load is coming from transactions writing data to disk. Amazon does document that Aurora is sensitive to IO:XactSync session pressure due to high frequency transactions, and they recommend batching transactions to reduce such pressure. We also found resources showing how others have proven by example that batching transactions works as a solution here.
Aurora PostgreSQL is a proprietary database that implements part of the Postgres model and maintains API parity with Postgres versions. Aurora uses a multi-AZ storage model to provide extremely high availability guarantees. This feature comes with the cost of more expensive writes. A pure Postgres instance via Amazon RDS would not ever see these IO:XactSync events.
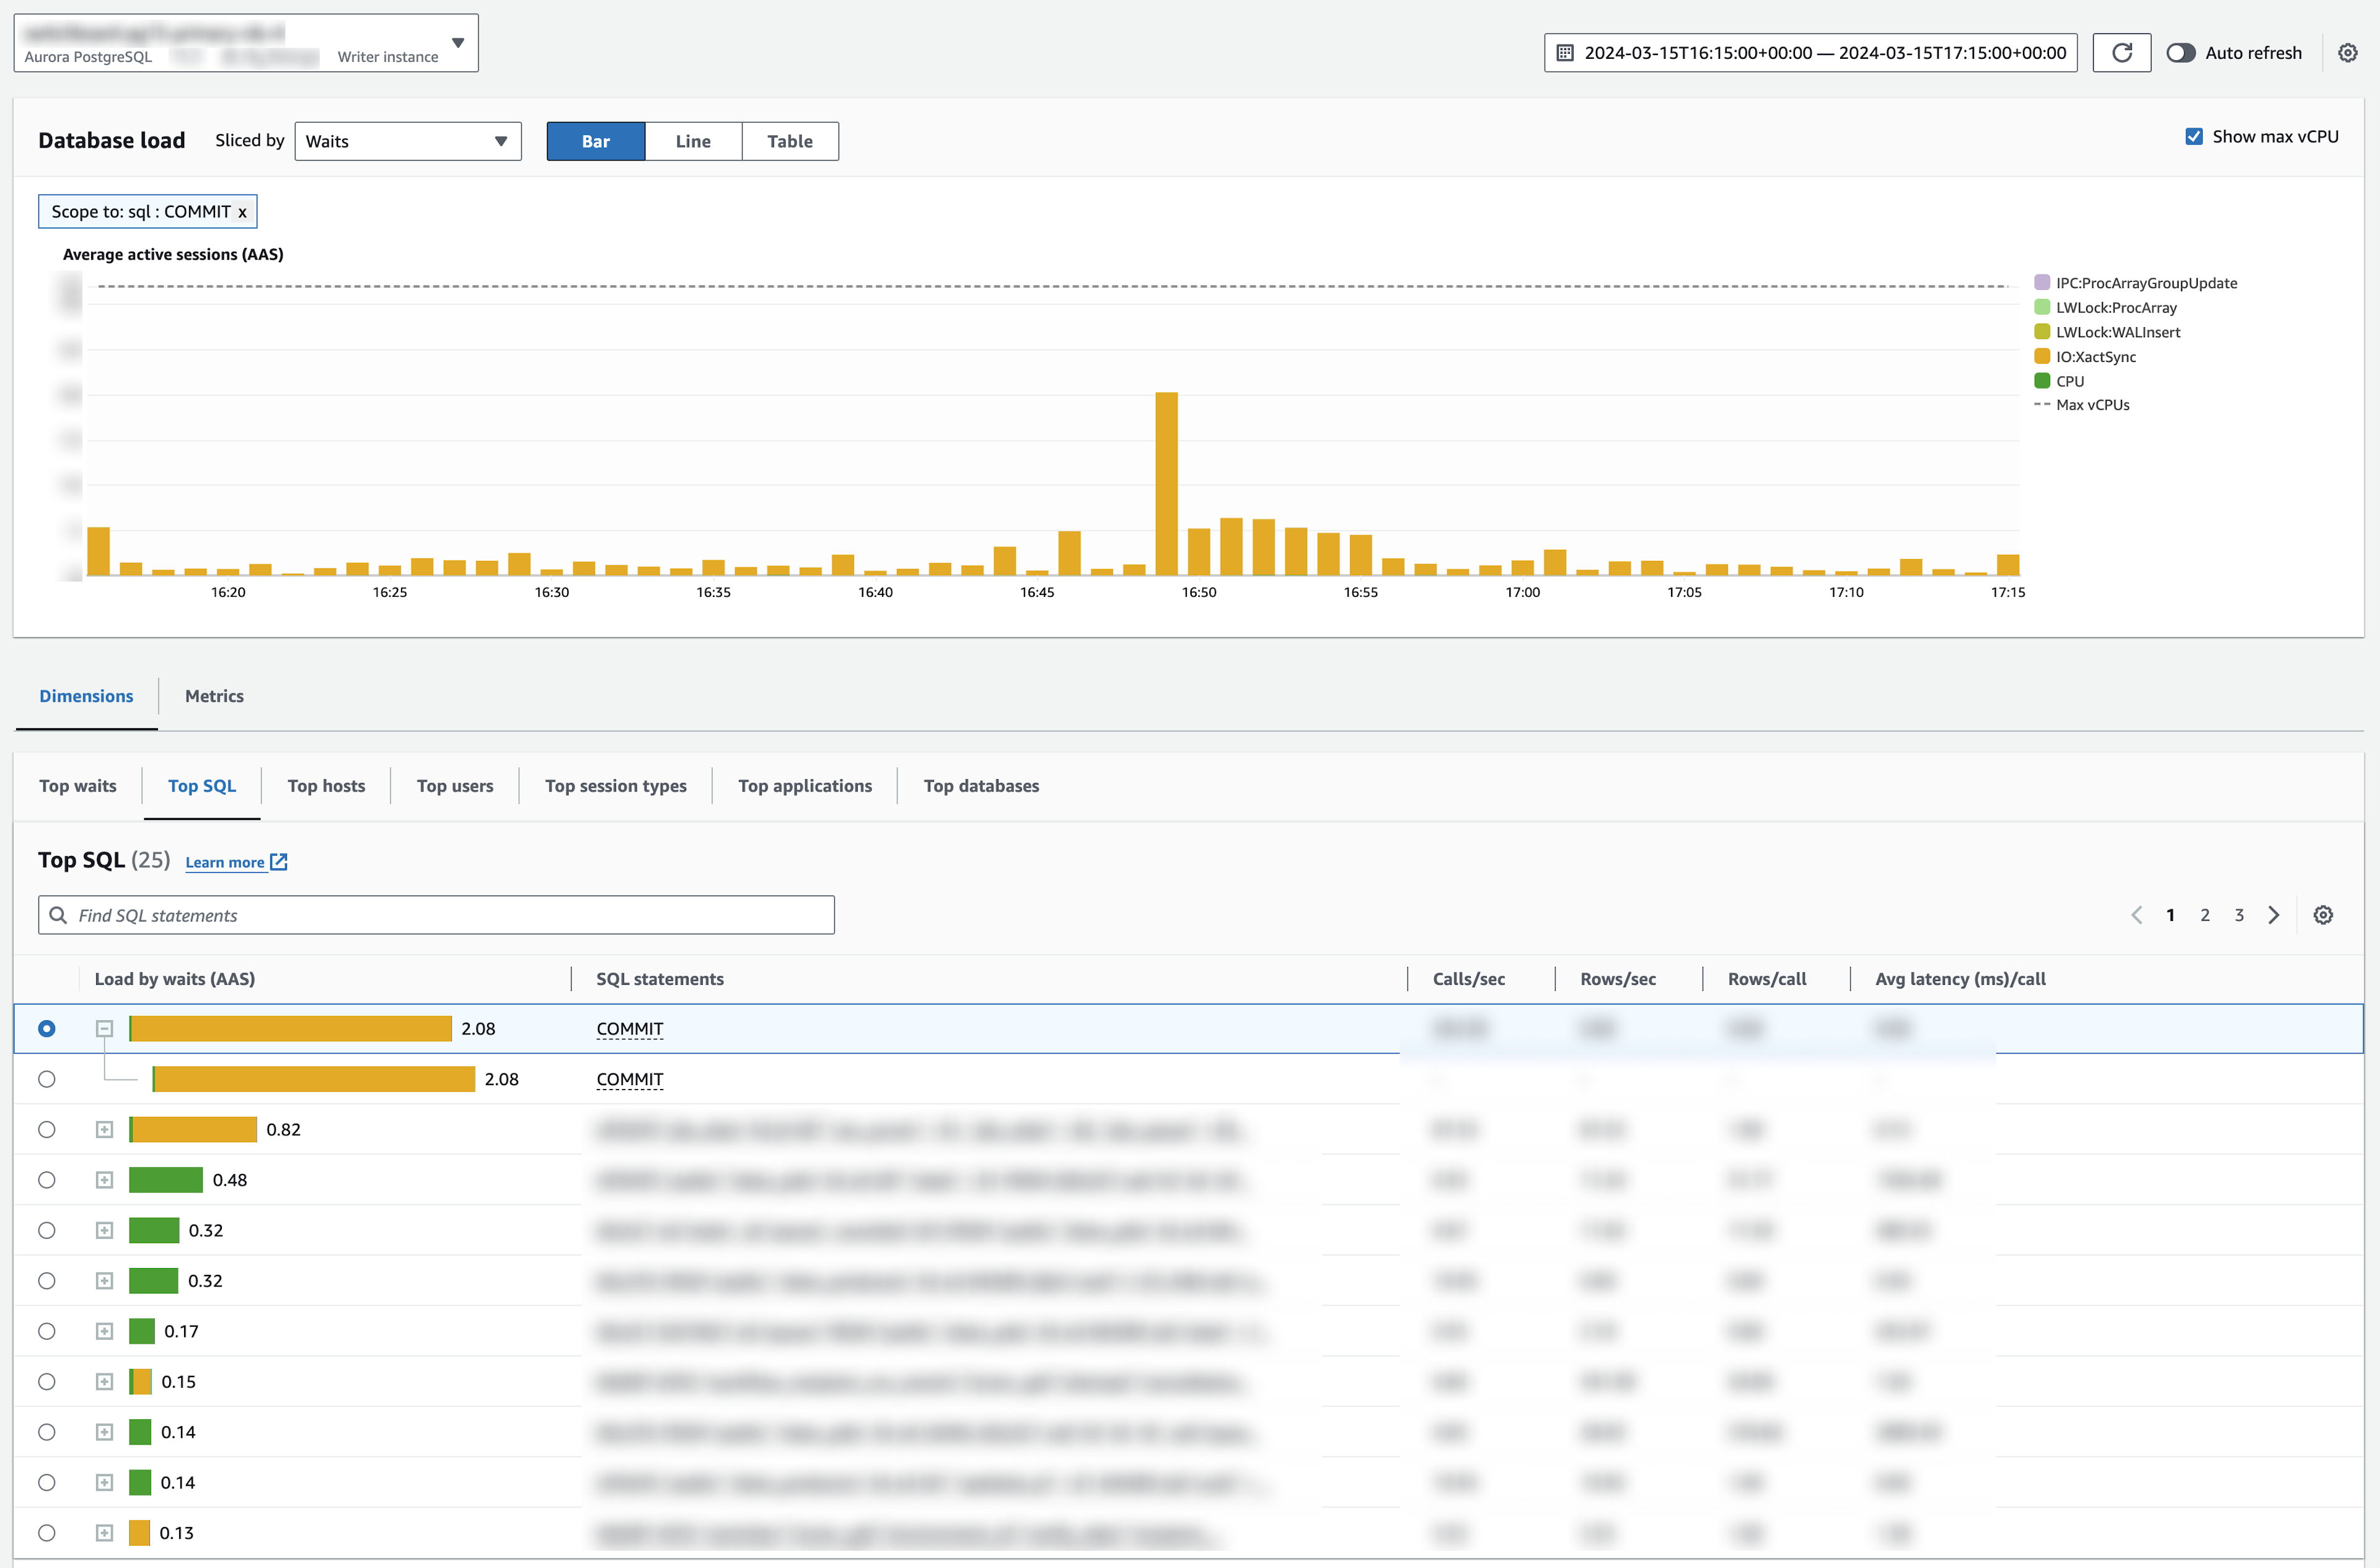
However, what these visualizations lack is further granularity. While Aurora will highlight individual read and write queries that occur outside an explicit transaction, any queries executed within an explicit transaction get lumped into the COMMIT statement issued at the end to close and execute the transaction queries.
And therein lies the issue we faced. We occasionally see large spikes in active session activity associated with IO:XactSync sessions from COMMIT statements. While we can tolerate these spikes briefly, they can become a stressor. Recently, we started investigating how we might reduce the severity and frequency of these spikes.
Following our intuition
The first thing we did is see if it is possible to have Aurora identify individual queries within a transaction in the insights dashboard. Aurora does have some documentation covering its methods for building SQL digests for the insights dashboard. But, we failed to identify a way to configure digests to enumerate transaction queries individually.
Next, we tried following our intuition. We used our distributed tracing and real time metrics to identify the parts of our systems under the most stress during these spikes in transaction activity. We found several high frequency transactions that could be either removed or shortened with relative ease. We hoped that these transactions might be causing the pressure here.
Unfortunately, even after several rounds of aggressive optimization, we observed negligible impact on session pressure spikes.
Hacking our Postgres driver
Despite the disappointing results from that first round of refactoring, we still felt confident that session pressure was coming from a bucket of remaining transactions, each executed with high frequency or with large amounts of data flowing through. However, further refactoring each of these would prove a non-trivial effort. Ideally, even if we couldn't get query-level insights granularity for transaction statements, we wanted to understand which transactions were the biggest contributors to session pressure, so we could prioritize our refactoring efforts.
At this point, we landed on a potential hack to force Aurora to provide us with more granular insights: SQL comments. We got this idea from Metabase, a SQL GUI we use to quickly connect to some of our replica DBs. We had previously noticed that Metabase prepended a -- Metabase comment at the head of every SQL query issued, and most importantly, that Aurora preserved this comment in its SQL digest. We wondered: could we force Aurora to enumerate COMMIT statements with prepended SQL comments?
To even accomplish this, we first needed to figure out how to inject the SQL comments into the COMMIT statements issued to close transactions. Thankfully, this turned out to be fairly straightforward!
At Knock, we use the Elixir programming language for all our backend services and the Ecto library for interfacing with our databases at runtime. Ecto itself is database agnostic, wrapping the Postgrex library, which is the actual driver that executes SQL queries for our Elixir code. First, we dug through the Postgrex library code and identified the point at which it executes COMMIT statements (see here):
def handle_commit(opts, %{postgres: postgres} = s) do
  case Keyword.get(opts, :mode, :transaction) do
    :transaction when postgres == :transaction ->
      statement = "COMMIT"
      handle_transaction(statement, opts, s)

    :savepoint when postgres == :transaction ->
      statement = "RELEASE SAVEPOINT postgrex_savepoint"
      handle_transaction(statement, opts, s)

    mode when mode in [:transaction, :savepoint] ->
      {postgres, s}
  end
end
From there, thanks to a well-designed and consistent API from the Ecto library authors, the rest was easy. The handle_commit/2 function shown above accepts an opts keyword list as its first argument. Ecto ensures that most public-facing functions accept a list of generic options, and that any options get passed all the way down to the driver layer.
So, all that was needed was a small update to Postgrex to inject a comment provided by a custom option passed in by the caller. You can see the diff on our fork here:
statement =
  case Keyword.get(opts, :commit_comment) do
    comment when is_binary(comment) -> "-- #{comment}\nCOMMIT"
    _ -> "COMMIT"
  end
Lastly, we wrote a macro to auto-generate COMMIT statement comments based on the current code location:
defmodule MyService.Repo do
  use Ecto.Repo, otp_app: :my_service, adapter: Ecto.Adapters.Postgres

  @doc """
  A wrapper around `transaction/2` that builds a comment based on the caller
  code location to inject alongside the `COMMIT` statement to execute the
  transaction.
  """
  defmacro transaction_with_comment(fun_or_multi, opts \\ []) do
    quote do
      fun_or_multi = unquote(fun_or_multi)
      opts = unquote(opts)

      opts =
        case MyService.Repo.build_commit_comment(__MODULE__, __ENV__) do
          comment when is_binary(comment) -> Keyword.put(opts, :commit_comment, comment)
          _ -> opts
        end

      MyService.Repo.transaction(fun_or_multi, opts)
    end
  end

  @doc """
  Given a module alias and a well-formed macro env context, returns a string
  representing the current function call and line location.
  """
  @spec build_commit_comment(mod :: module(), env :: Macro.Env.t()) :: String.t() | nil
  def build_commit_comment(mod, %Macro.Env{function: {func, arity}, line: line_num})
      when is_atom(mod) do
    case MyService.Utils.module_alias_to_string(mod) do
      mod_str when is_binary(mod_str) -> "#{mod_str}.#{func}/#{arity} (L#{line_num})"
      _ -> nil
    end
  end

  def build_commit_comment(_, _), do: nil
end
Ideally, this would mean that a transaction executed like:
defmodule MyService.MyDemo do
  require MyService.Repo

  def execute(something, something_else) do
    MyService.Repo.transaction_with_comment(fn ->
      MyService.Repo.insert(something)
      MyService.Repo.delete(something_else)
    end)
  end
end
Would be executed with a COMMIT statement looking like:
-- MyService.MyDemo.execute/2 (L5)
COMMIT
Shipping it
From here, all that was left was to :shipit: and see. To our delight, this hack worked exactly as intended. We immediately started seeing COMMIT statements enumerated by the prepended SQL comments, each of which identified the originating transaction.
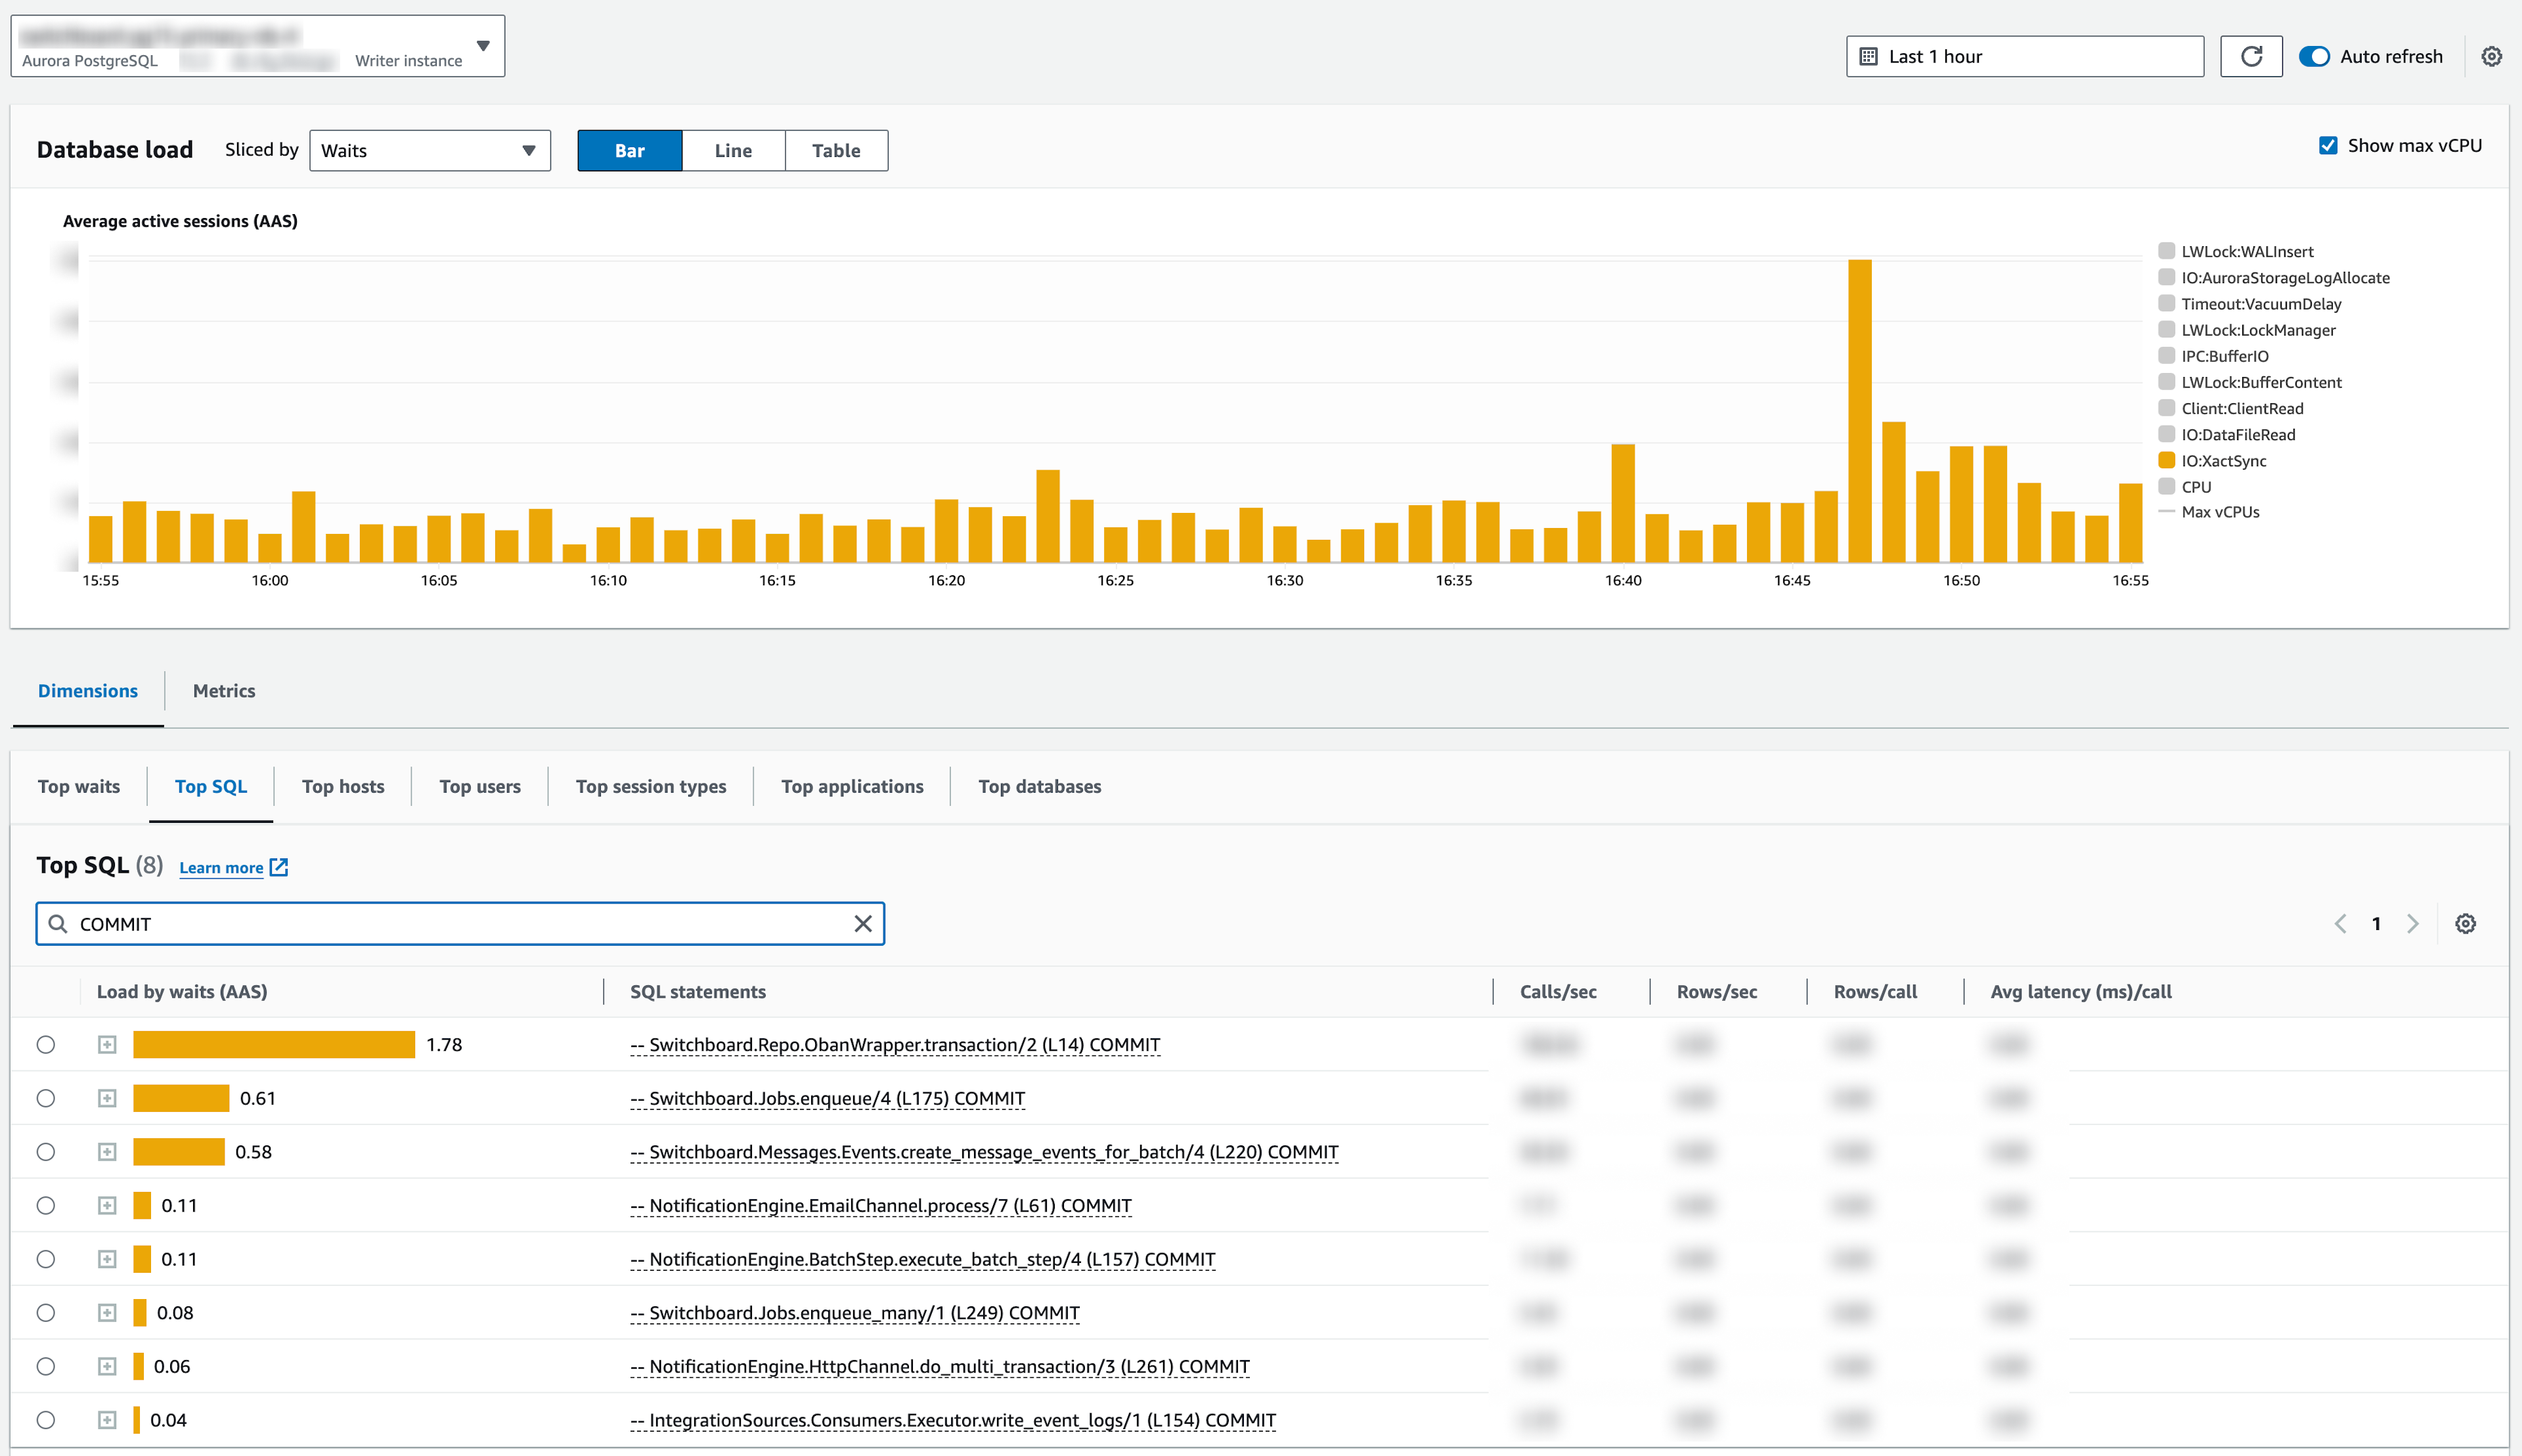
Thanks to these insights, we were able to more confidently identify our most expensive transactions. Based on these findings, we're currently working on a project to more aggressively batch creation of notification message events. After that, we're going to explore ways to move some deferred job data out of our database and into other datastores.
Conclusion
When we first shipped this, we envisioned it as a temporary hack. However, we have quickly grown to appreciate the additional granularity in performance insights. Moreover, we haven't observed any performance impact on our query or runtime layers with these comments injected.
So, we recently decided to make this feature permanent in our core backend runtime. We don't love that we are now on a fork of our Postgres Elixir driver, so we're also opening a discussion with the Ecto maintainers about upstreaming this change.
In the process of investigating this issue, we struggled to find prior resources online covering how to debug Aurora databases with a large share of session activity associated with transaction COMMIT statements. We now know that using SQL comment injection is a safe and effective way to force Aurora to provide more observational granularity. We hope this may be useful to others working on similar problems in other languages.