Today we’re excited to announce that our Datadog extension is now generally available for all Knock customers. With this release, it’s easier than ever for engineering teams to monitor their Knock notifications system from the tool where they monitor the rest of their stack: Datadog.
tl;dr: Our Datadog extension enables you to stream key metrics (such as message failures) into your Datadog dashboard in realtime.
The Datadog extension is now available to all Knock customers, including customers on our free Developer plan. You can learn more about integrating Datadog with Knock in our docs.
Bringing notifications monitoring to our customers
Prior to this release our customers would use the Knock debugger and our other observability tools to dig into potential issues and understand how their notifications are sent to customers.
Those tools are perfect when you’re developing new notifications or actively debugging a known issue within Knock, but our customers told us they also wanted a way to monitor their notification metrics in the dashboards where they monitor the the rest of their stack. And while our engineers monitor and respond to our own suite of alarms, reports, and metrics around the clock, we wanted to introduce a way to give additional peace of mind to those teams with additional operational requirements.
Introducing: Knock + Datadog
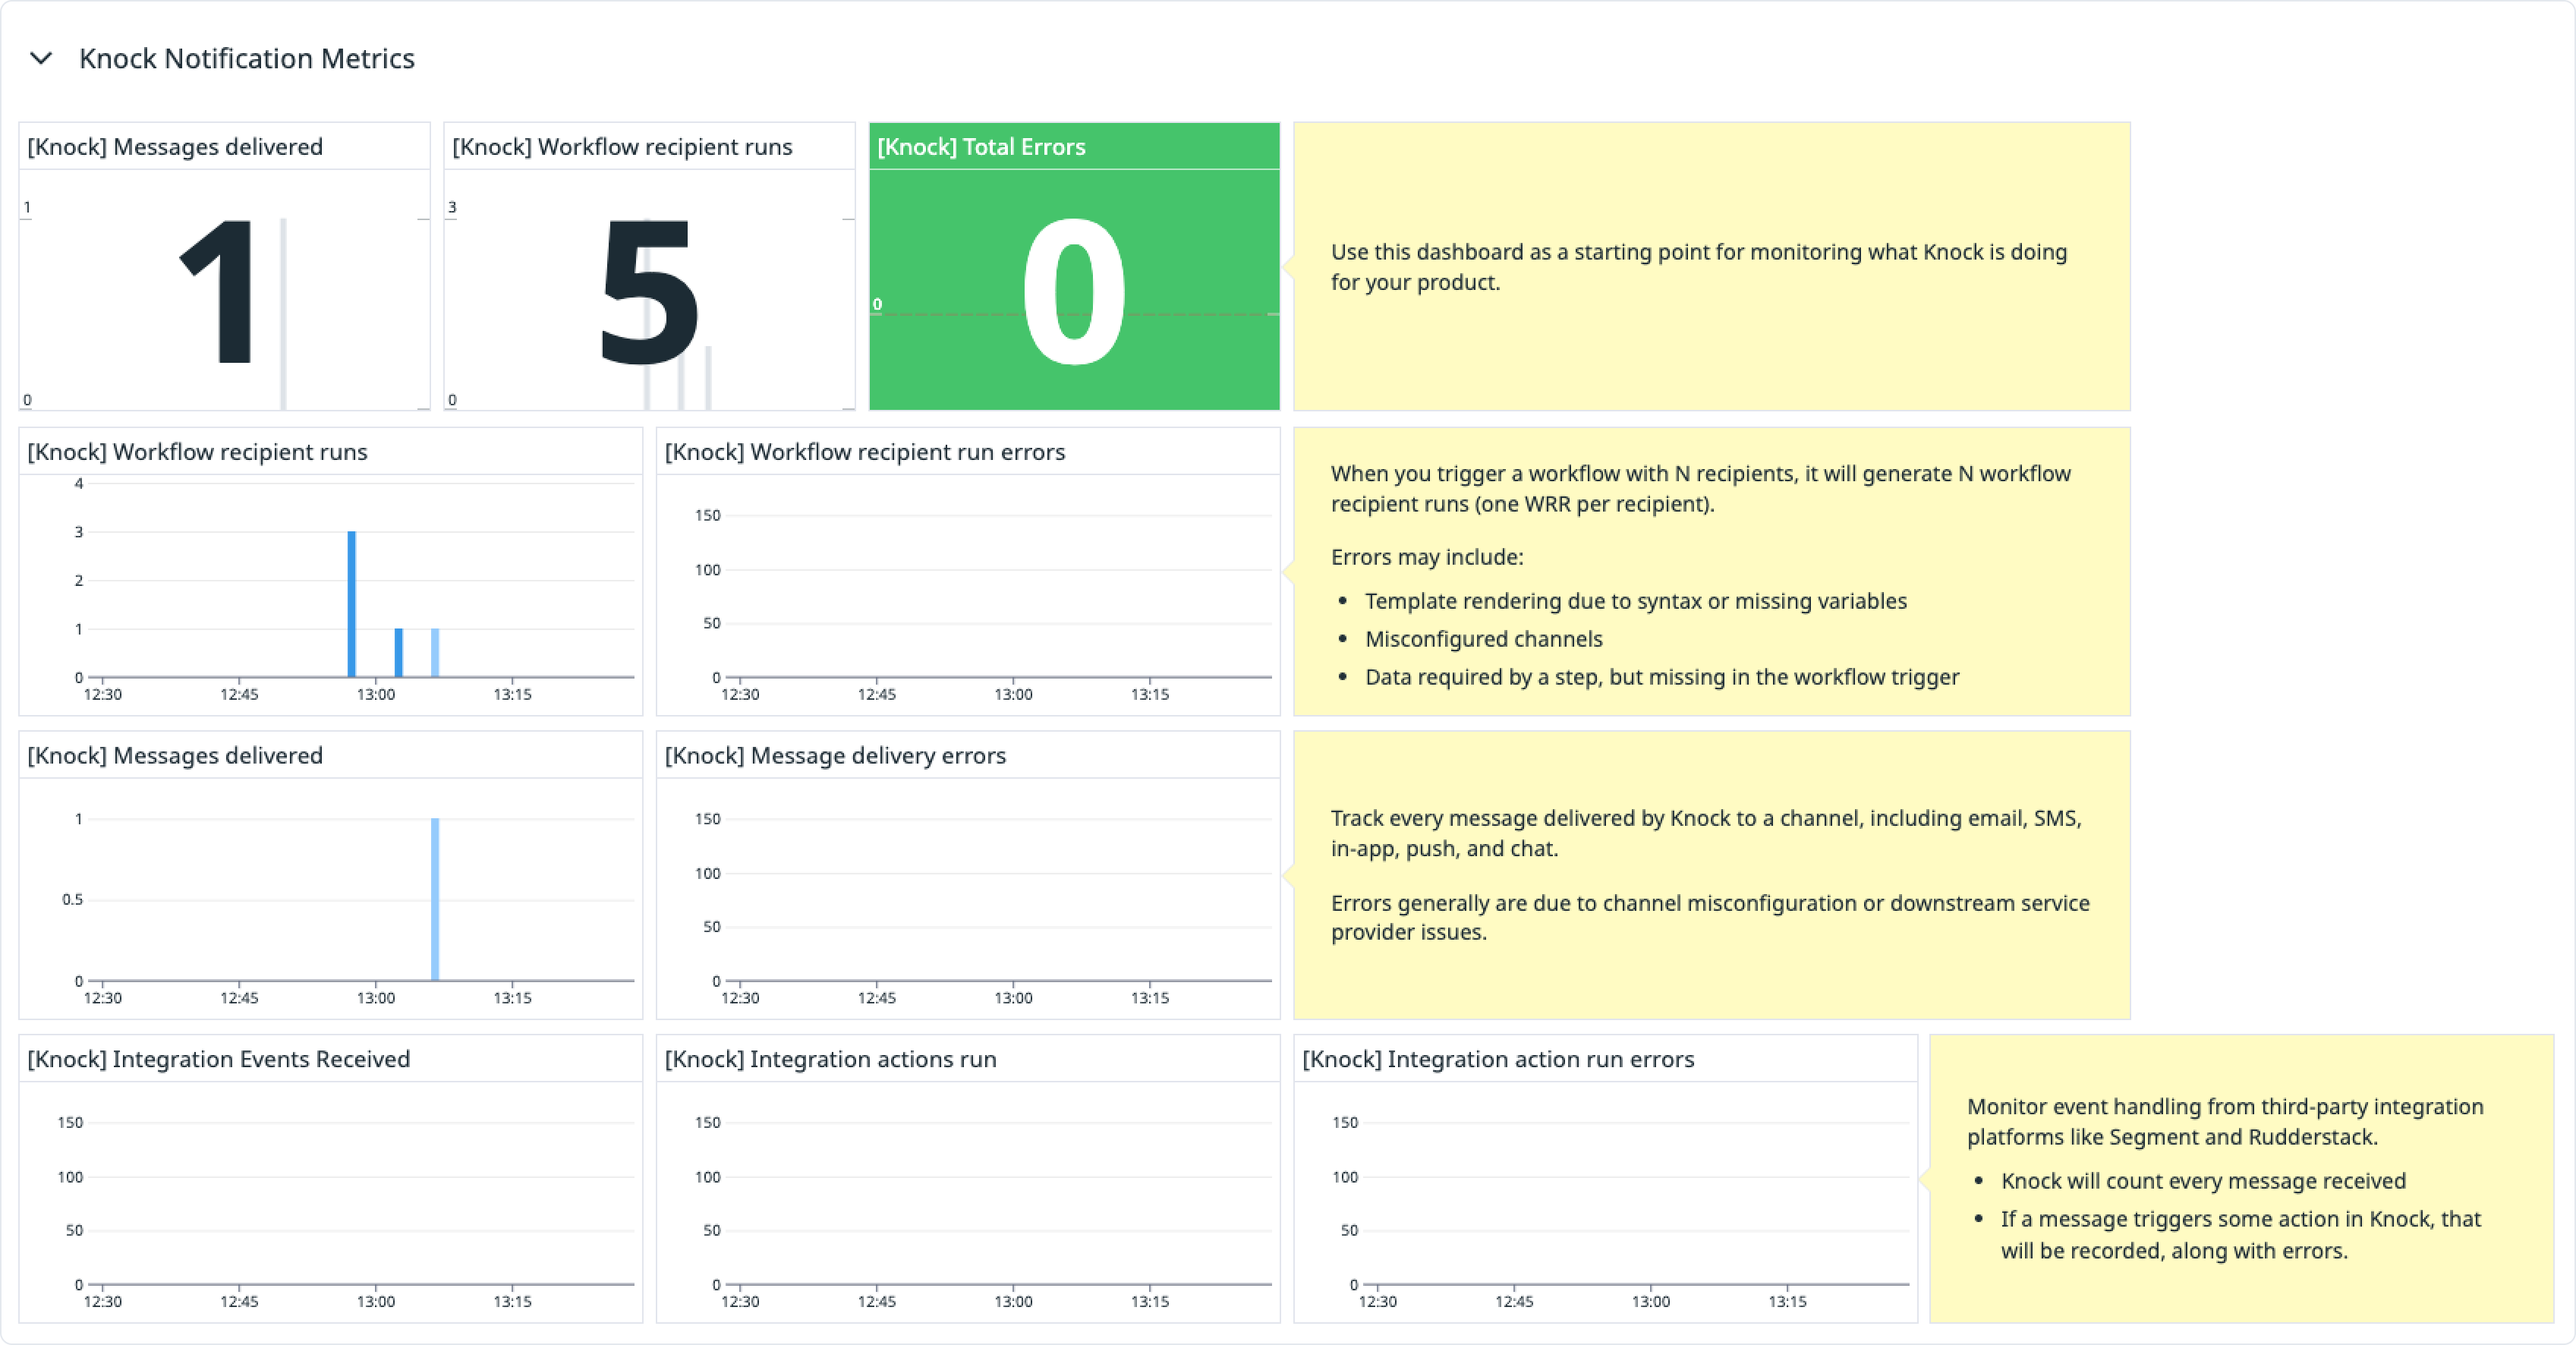
With the Knock Datadog extension you can set up a stream of message, workflow, and/or channel metrics to your Datadog instance in minutes. All metrics are tagged (where applicable) to give you the full context you need for a given message, including its environment, channel, and workflow.
In the beta release of our Datadog extension, we saw customers detect and respond to issues with misconfigured channels, expired credentials, changes in authorization, or other issues that could result in critical notifications failing to send to customers.
Datadog is a pivotal tool in visualising and monitoring services throughout our tech stack. For a 3rd party provider, such as Knock, to offer a simple yet powerful integration has meant we can monitor our suite end-to-end, ensuring our customers receive the best possible service and that we know of issues before they’re raised by customers. — Taylor McCarthy, Engineering Team Lead at EdApp
At SwayDM we already have multiple systems that feed into Datadog for aggregating logs, metrics, and alerting. Having the ability to easily integrate Knock metrics into our existing Datadog dashboards allowed us to hook Knock into our existing monitoring and support workflows, and gives us the peace-of-mind to know our notifications are getting out to customers. — Andrew Glassman, co-founder and engineering leader at SwayDM
When issues potentially come up, we don't want to be scrambling to set up observability—we want to know about the issue and jump into it. Knock's Datadog extension gives our team the peace-of-mind to know that if something comes up, we'll be able to see Knock logs in the same place where we review our request logging. — Jay Ashe, CTO at Poppy Flowers
We’re excited to see the Datadog extension bring these same monitoring capabilities to the rest of our customer base. If you want to quickly get started with a helpful Datadog dashboard, you can use our starter kit to spin up a pre-built dashboard with key notification metrics.
Let us know what you think. We’d love your feedback on this extension and to hear from you on what you’d like to see us build next!
Knock on 🖖